Is DOGE Triggering a DC Housing Crash? Track the Market Live

Is DOGE Triggering a DC Housing Crash? Track the Market Live
DOGE-driven cuts to the federal workforce have the potential to fundamentally reshape DC's housing market. This weekend, we watched as posts about DC real estate went viral, with hot takes about market direction spreading widely – all without data or context to back them up. It's no surprise: legacy housing data lags by months and sits behind paywalls, creating an information vacuum exactly when clarity matters most.
We believe housing data should be timely, transparent, and accessible – especially during periods of volatility and uncertainty like DC is experiencing now. That's why we've launched a free, daily-updated dashboard tracking critical housing metrics across DC proper and the metro area, powered by the Parcl Labs API.
Our new dashboard delivers insights on:
- Real-time home prices (via the Parcl Labs Price Feed)
- New listing volume
- Price cut activity
Updated daily. Available via an intuitive, open dashboard. Access it here and read on to learn more about the current state of DC housing market.

DC Housing Market Was Underperforming Before DOGE
DC housing weakness - particularly at the city level - predates DOGE. The market now sits 21.2% below its peak values and is now below March 2020 levels. DC city is down 6% YoY.

DC metro has performed substantially better than its urban core, rising 27.9% since March 2020 and gaining 6% YoY - creating a striking 12-point performance gap between metro and city levels this year alone. This city-metro divergence has been a persistent theme in our reporting this year.

This longer-term weakness sets an important backdrop for understanding today's market dynamics, as DOGE-driven federal job cuts and broader budget reductions threaten to add new pressure to the local DC economy.
Tracking DOGE's Impact: What to Watch
Our DC dashboard focuses on three key metrics that could signal potential DOGE-driven market stress:
- Rising new listings (as displaced workers sell)
- Increasing price cuts (as motivated sellers compete for buyers)
- Downward price pressure
Critically, we present these metrics against seasonal patterns through year-over-year trends. This context helps distinguish normal market fluctuations from potential DOGE-driven disruption.
Here's what the data currently shows:
DC City Home Prices Are Falling, But New Listings and Price Cutting Is Within Normal Ranges
Updated February 18, 2025
The standout story: DC city home prices have dropped 11% year-to-date – a decline that clearly stands out from seasonal patterns. However, 7-day new listings and price cuts appear to be in range of seasonal norms and patterns.

Home Prices: $474.83/sqft
- ↓ 11% year-to-date
- ↓ 7.62% past 30 days
- ↓ 5.8% year-over-year
New Listings: 248 this week
- Trending up recently: +4.2% week-over-week
- Running slightly above last year's levels (248 vs 238)
Price Cuts: 21.9% of active inventory
- Accelerating: +12.75% week-over-week, +22.62% month-over-month
- But still -18.5% below last year's elevated levels during the same period
DC Metro Prices Are Flat, With Mixed Signals in Listing Activity
Updated February 18, 2025
The metro story contrasts with the city, but shows some emerging softness. After a late January increase, prices have been falling during a period that typically sees pre-spring strength. Listing volume is down below 2023 and 2024 levels. Price cut activity, while below this time last year, took a very strong uptick in late February, aligned with the timing of the price declines.
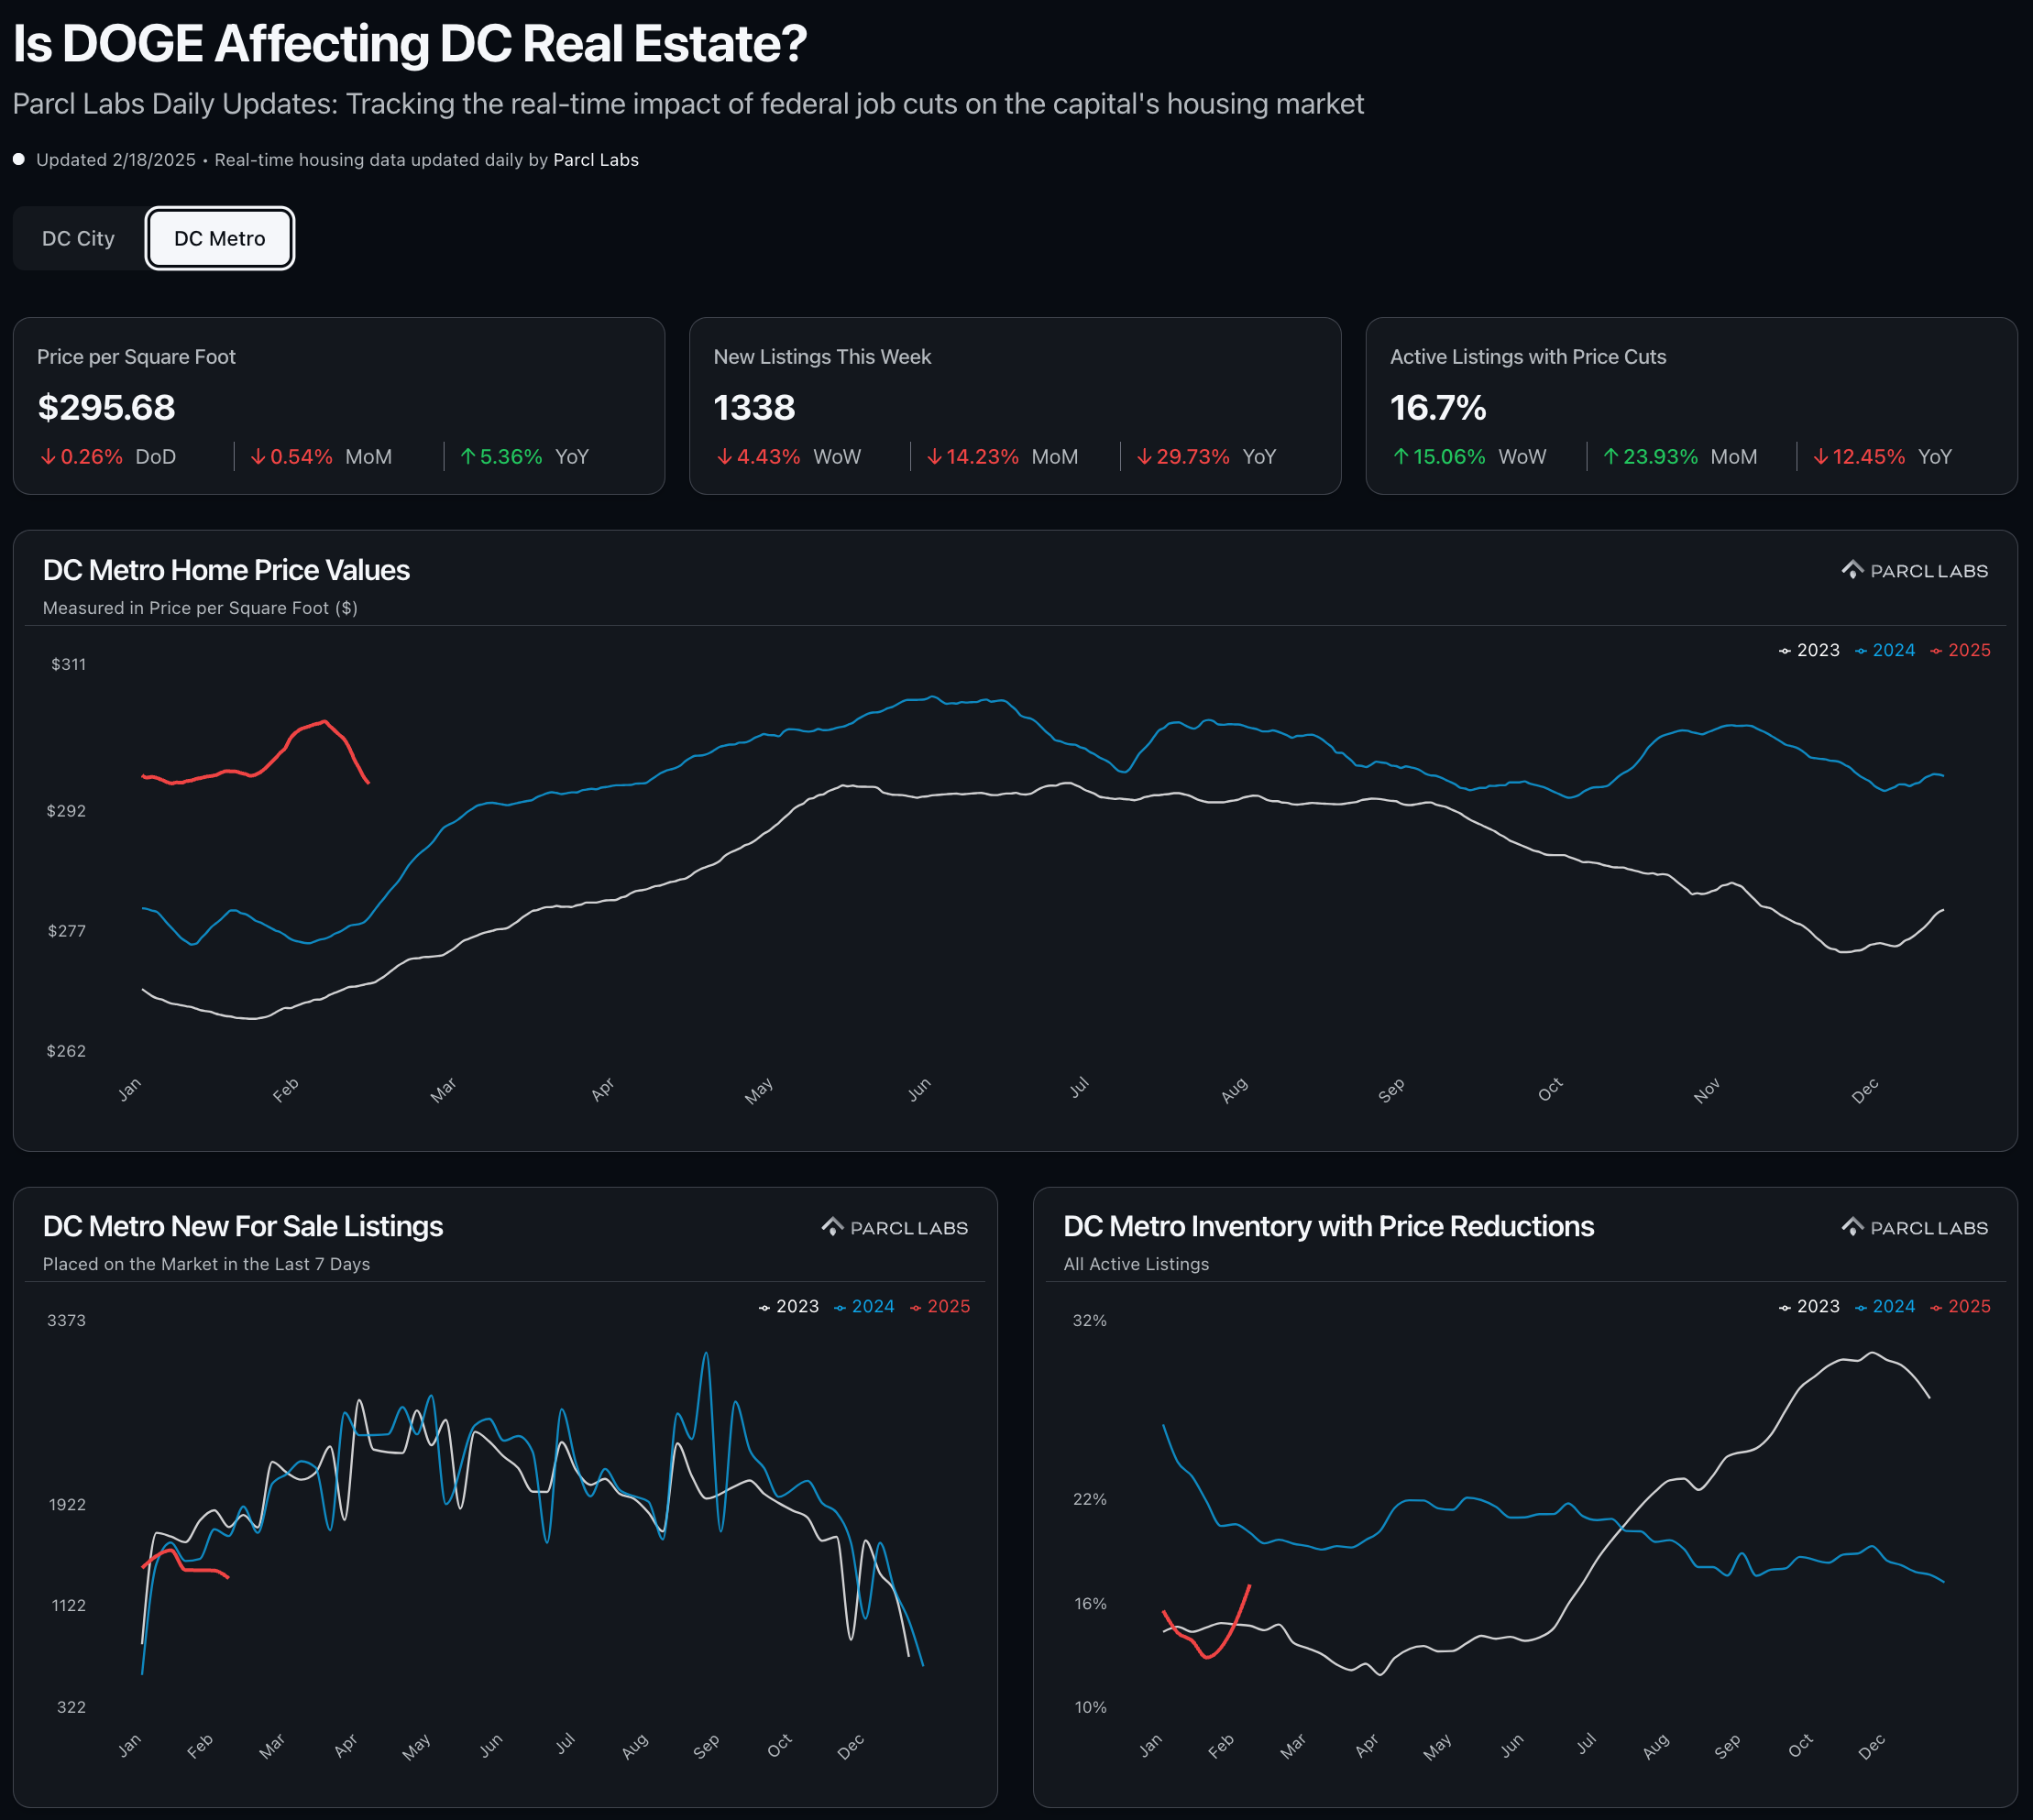
Home Prices: $295.68/sqft
- ↓ 0.36% year-to-date
- ↓ 0.54% past 30 days
- ↑ 5.36% year-over-year
New Listings: 1,338 this week
- Down recently: -4.43% week-over-week, -14.23% month-over-month
- Below last year (-29.73% year-over-year)
Price Cuts: 16.7% of active inventory
- Rising recently: +15.06% week-over-week, +23.93% month-over-month
- But -12.45% below last year's levels
What Does The DC Data Tell Us? Takeaways (For Now) & Next Steps
DC home prices - particularly in the city - are in decline. The recent -11% YTD drop isn't just large, it's diverging sharply from seasonal patterns we saw in 2023 and 2024. However, claims of a listing surge from federal job cuts are not supported by the data (yet).
TL;DR: It's early, and signals are mixed. We'll be tracking this story daily through our dashboard – access it here.
Want to go deeper?
We've seen excellent follow-on questions around DC housing market and potential impacts of DOGE, like:
- Supply-demand dynamics in high-income, contractor-heavy DC suburbs
- RTO's impact on transit-accessible areas in DC
- How other supply/demand factors - like new condo supply coming online - may contribute to current price performance
- How and if recent trends diverge from typical administration turnover
All of these questions and more can be answered directly with the Parcl Labs API which gives you programmatic access to our full property and market-level datasets. Sign up for free to start your own analysis.
P.S. - This trend does diverge from Administration turnover norms... The early 2025 decline stands in contrast to the same period in 2021:

Stay tuned.


