Is the Case Shiller Index Broken?

Executive Summary:
- Beginning in 2022, the duration between paired sales activity in San Francisco nearly doubled, from 6.3 years to 11 years
- The Case Shiller Index discounts these older/low-turnover homes as much as 45%; it’s unclear what the weight is (if any) for transactions featuring homes that haven’t traded in 10+ years
- Dynamics within the San Francisco housing market have changed so abruptly that it’s possible it has ‘broken’ the region’s Case Shiller index; we believe that CS SF is now capturing a minority of the activity that is actually moving the SF housing market
- San Francisco (10.9 years), LA (8.2 years), San Diego (7.7 years), and Boston (7.7 years) all represent markets where the Case Shiller methodology is moving in the opposite direction of on-the-ground activity
- Parcl Labs provides the only real-time, representative price index of the housing market. The Parcl Labs Price Feeds monitor actual live trades across property types in any market.
Is the Case Shiller Index Broken in San Francisco?
The Case Shiller Index measures changes in home values through paired sales (i.e., repeat sales). The index calculates changes using only existing single-family home resale pairs, excluding new construction and condominiums.
Based on an analysis of paired sales activity for single family homes in the San Francisco housing market, it appears that most activity being traded today (and over the last ~2 years) is discounted as much as 45%. It’s unclear how homes that haven’t traded in 10+ years are weighted, if at all.
To understand this better, we need to examine the Case Shiller methodology, specifically how time intervals are leveraged.
Taking an excerpt from the methodology:
Time Interval Adjustments. Sales pairs are also weighted based on the time interval between the first and second sales. If a sales pair interval is longer, then it is more likely that a house may have experienced physical changes. Sales pairs with longer intervals are, therefore, given less weight than sales pairs with shorter intervals.
And reviewing a figure provided in the paper:

It becomes clear that the methodology itself is designed to discount, and possibly even remove, transactions of older/low-turnover homes.
Why is this important?
The typical paired sale transaction occurring in San Francisco over the last ~2 years is at these index limits - ie. the age of the most recent sale for the average home in San Francisco is going up and now sits at ~9 years. Within the last 3 months, the age of the average home transacted falls outside of upper bound of the weighting scale provided in the Case Shiller methodology.

Notice where these shifts occur on the figure provided in the Case Shiller methodological paper:

Is the Case Shiller Index Broken?
Now the question is whether there are other markets as extreme as San Francisco. There are several markets where the typical trade is getting down weighted even though it represents an increasing portion of activity occurring in the market.
Reviewing the markets that are now trending to longer durations between paired sales (Q3, 2024):
- San Francisco: 3,993 Days (10.9 years)
- LA: 2,993 Days (8.2 years)
- San Diego: 2,827 Days (7.7 years)
- Boston: 2,824 Days (7.7 years)
The most stable market since 2016 has been Las Vegas.
The markets with the most downward shift (shortening of duration between paired sales, i.e. higher weight allocated to these trades based on CS methodology):
- Chicago: 253 Days (0.7 years)
- Washington, DC: 543 Days (1.5 years)
- Miami: 545 Days (1.5 years)
- Denver: 948 Days (2.6 years)
- New York: 1,234 Days (3.4 years)

What’s notable about Chicago is that the Case Shiller Index also explicitly removes trades occurring within 6 months of one another. The typical transaction happening in Chicago right now is very close to that 6 month window. A large share of Chicago activity is not being included in the index for the opposite reason: the last sale happened too recently.
While the time interval is a recent shift in behaviors, shortfalls of the Case Shiller Index extend well beyond this element of the methodology.
In our report from June, 2022, we noted that the Case Shiller leaves out upwards of ~50% of transaction activity.
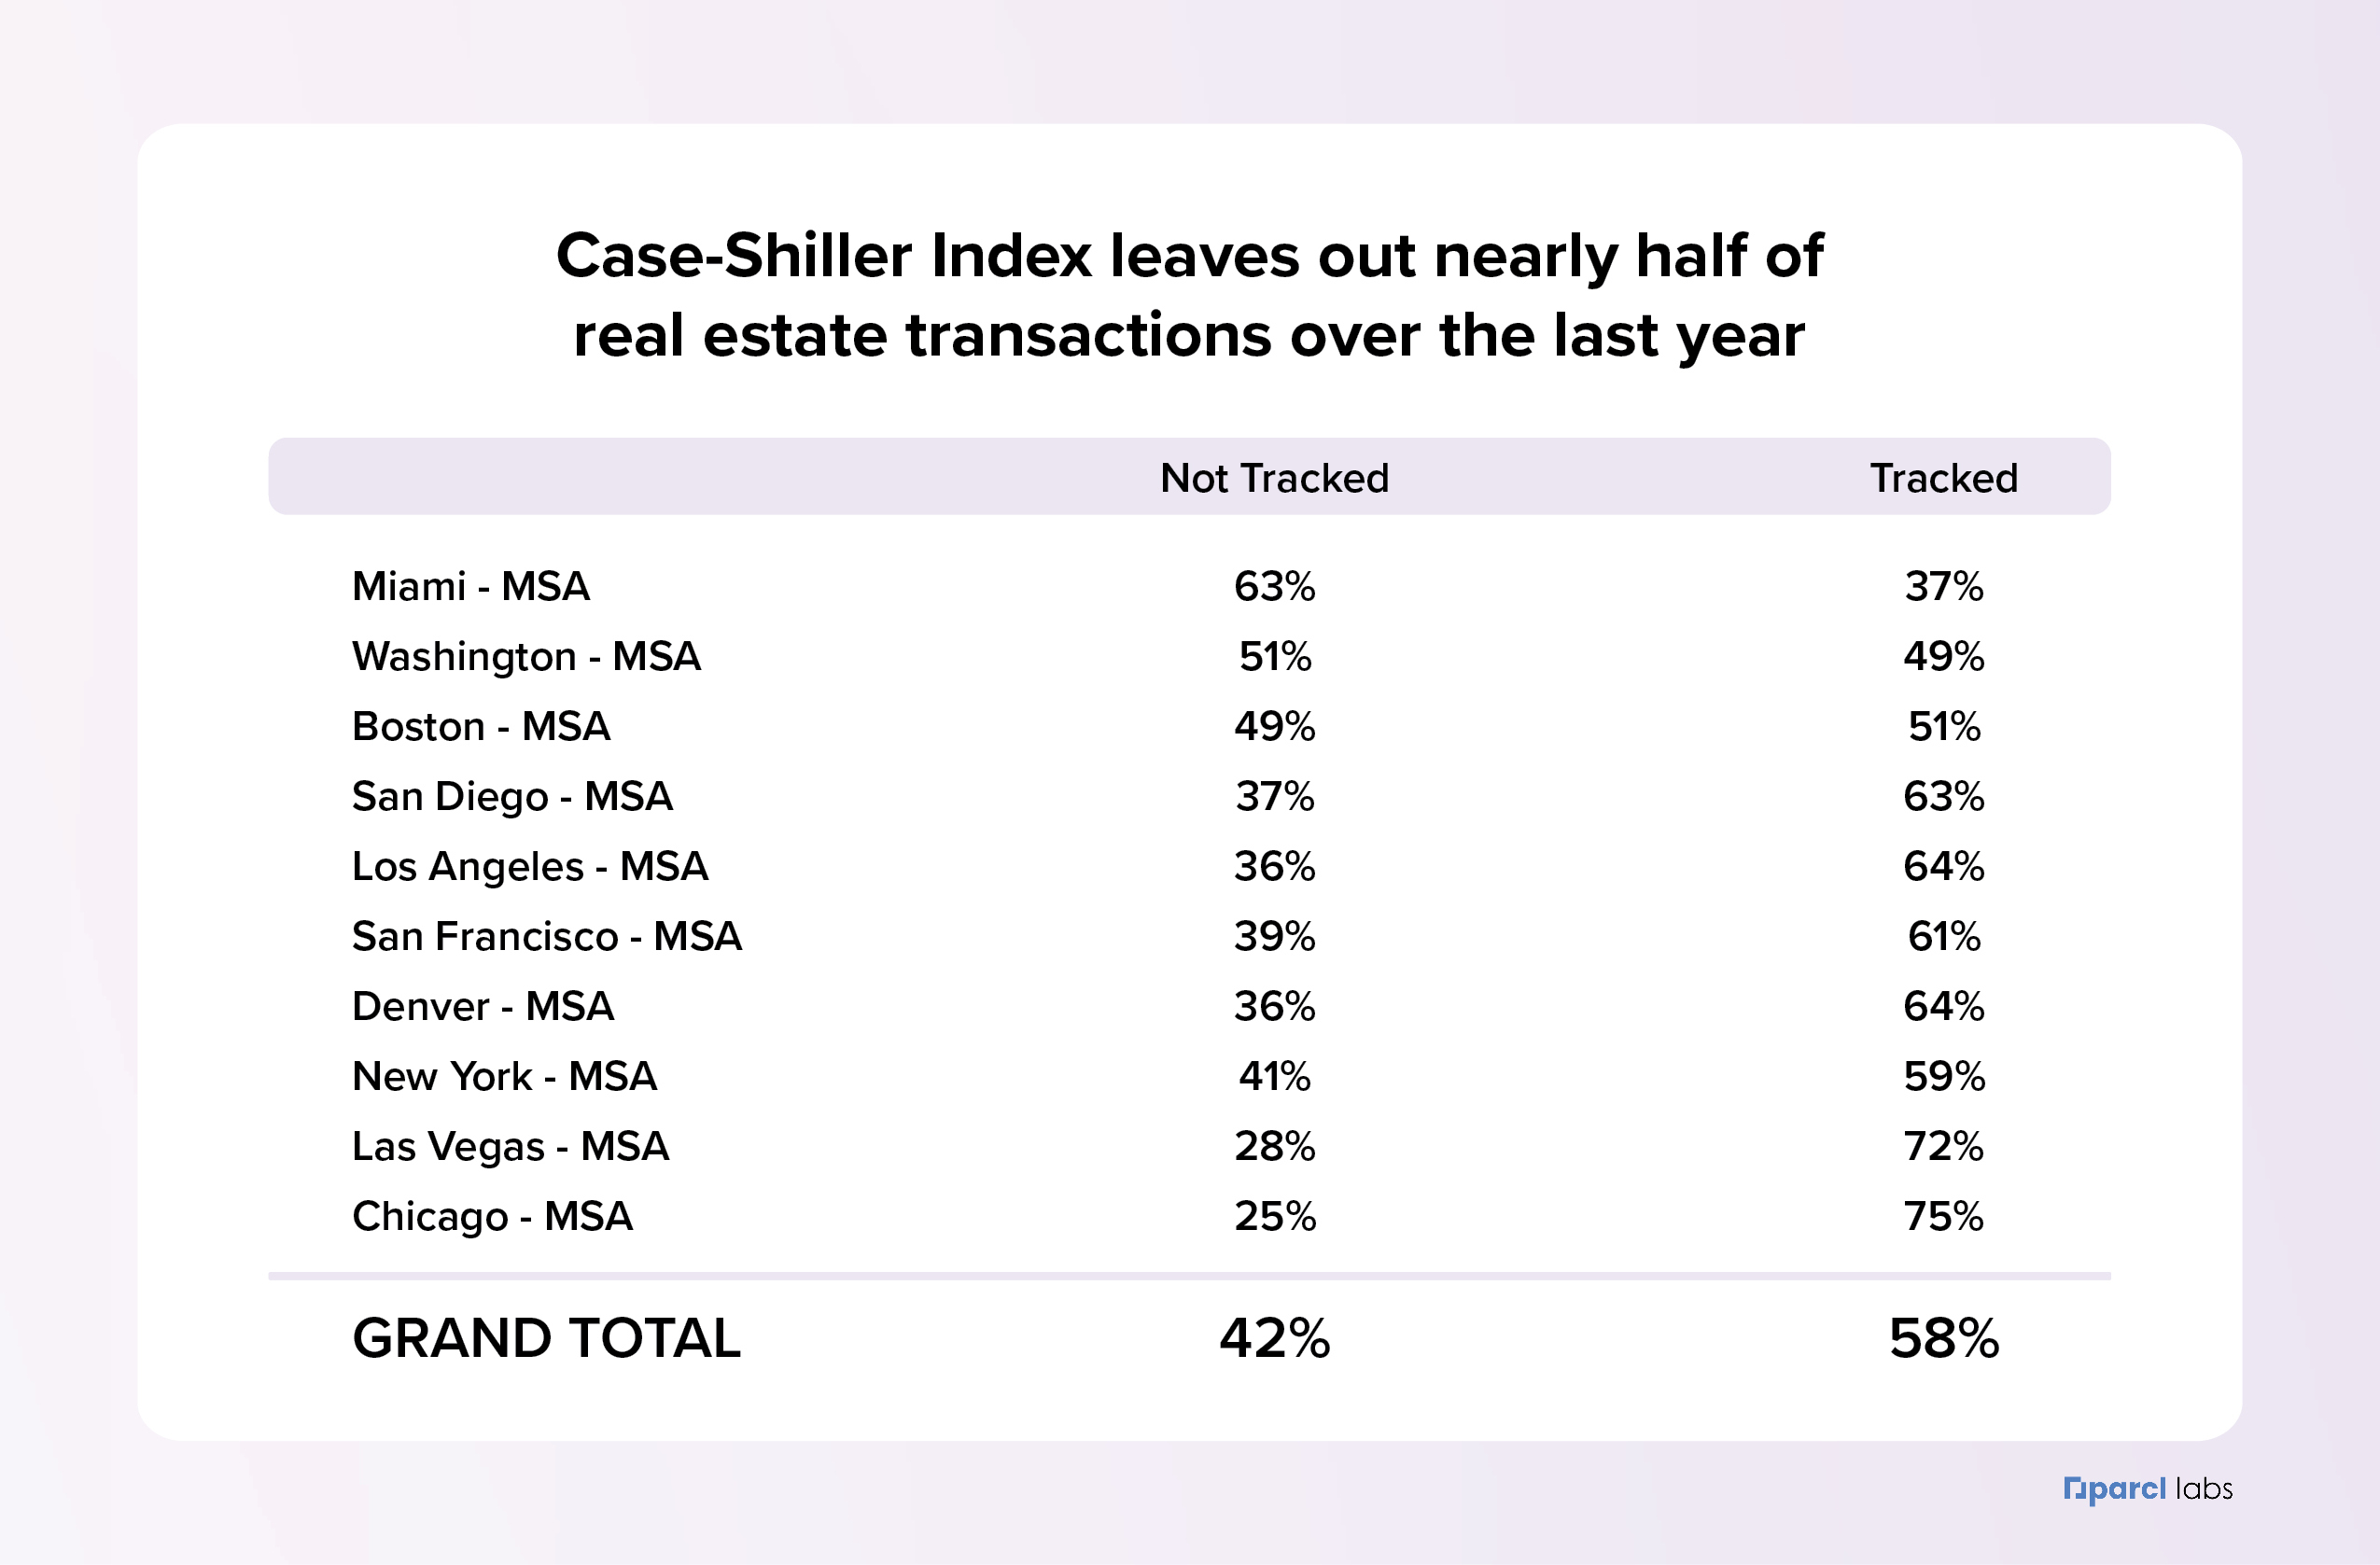
This is due to the exclusion of property types, new construction and fast paced turnover activity.
Furthermore, the Case Shiller Index is tracking large swathes of land, carefully curated “metropolitan areas”. They do not appear to be following any official definition of metropolitan areas:

Modernizing the Case Shiller Index
We believe the housing market is represented by the trades that are actually happening. This will be the fastest indication of shifts in consumer and institutional behavior in a non-seasonally adjusted fashion. Our objective is to provide the most real time, transparent view into the housing market. That’s why we created the Parcl Labs Price Feeds.
Every morning at 7am, we publish the price per square foot of housing markets across the country. An intuitive representation of the trades happening within markets that day.
Here’s a side by side against the Case Shiller Index:

And our daily updating price indices allow you to decouple markets and find inflection points:

We will continue to predict the Case Shiller Indices ahead of published numbers and couple them with our daily pricefeeds to understand what’s actually happening.
The Case Shiller Index lacks utility for the modern housing market.
See our predictions for:


.png)

