The Motivated Seller Index White Paper
Jul 1, 2026 · 6 min read
The methodology behind the Motivated Seller Index: how we measure seller urgency at the listing and market level.

The Motivated Seller Index
A measure of home-seller urgency
The Motivated Seller Index (MSI) measures how aggressively home sellers are cutting their asking prices - seller urgency. It is produced at two levels: a score for each individual listing (how hard one seller is cutting) and a score for each market (how widespread and severe urgency is across an area).
A market score is not a simple average of the listings in it. Averaging would let either a handful of deep discounters or a flood of brand-new listings distort the picture. Instead, the market score combines the intensity of the sellers who are cutting with the breadth of cutting across the market.
1. What we observe
For every active for-sale listing, on every day it is on the market, we track three quantities:
Signal | Meaning |
|---|---|
Days on market | how long the listing has been active |
Number of price cuts | how many times the seller has lowered the asking price during the current listing |
Total price change | the percentage gap between the current and original asking price (e.g. −7% means the home is now listed 7% below where it started) |
A listing is cutting when it has lowered its price at least once and its current asking price is below its original. Each listing is attributed to the seller who actually held the home on that date. Listings showing an implausibly large change (60% or more in absolute terms) are removed.
2. Scoring a single listing
Each listing receives a 0–10 urgency score. A listing that is not cutting — whether
brand-new or a long-sitting holdout — scores 0, because neither is urgent. A cutting
listing's score combines three distinct behaviors:

where c is the number of price cuts, d is the total price change (a negative fraction), and
DOM is days on market.
Term | What it captures | Maximum contribution |
|---|---|---|
Count | how many times the seller has cut | 4.5 (at 3 or more cuts) |
Depth | how large the total discount is | 7.0 (at a 20% cut) |
Velocity | how fast they are cutting (cuts per month) | 1.5 (at 1+ cut per month) |
Depth is the dominant signal — the coefficient credits discounts up to 20%, worth up to 7 of the 10 points. Days on market enters only as the denominator of the velocity term, never as a level of its own, so a listing is never scored as more motivated simply for sitting longer.
Each listing is then labeled from its score:
Label | Score |
|---|---|
Neutral | below 2.5 (every non-cutting listing scores 0, so it is always neutral) |
Stubborn | 2.5 to 5.0 |
Motivated | 5.0 to 7.5 |
Fire sale | 7.5 or above |
3. Scoring a market
A market score answers: how urgent is this market? It multiplies the intensity of
cutting by its breadth:
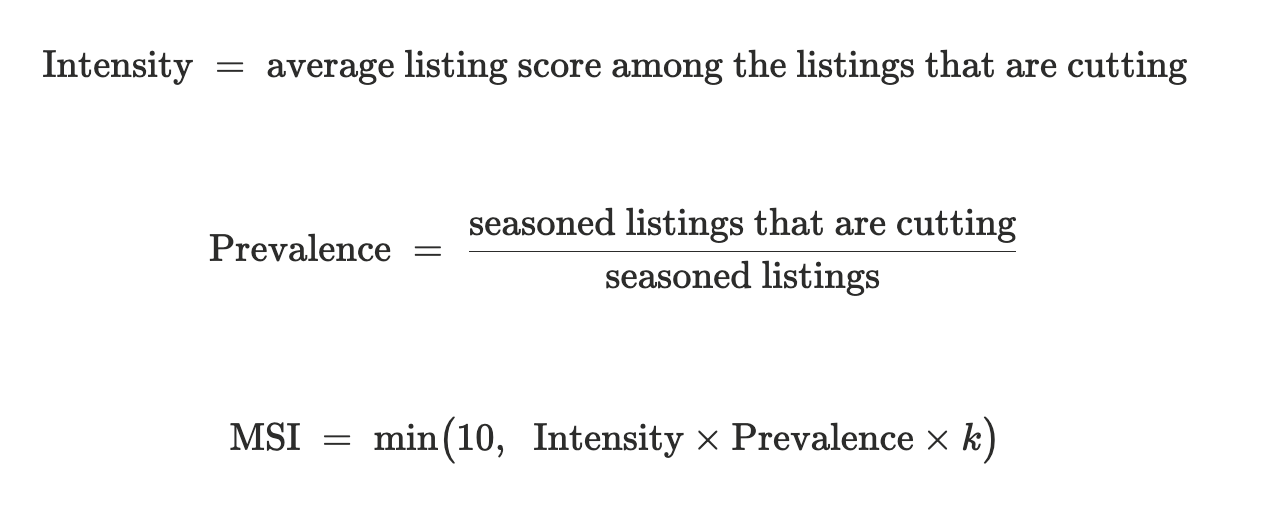
Intensity is the average urgency score among sellers who are cutting. On its own it
is robust to inventory turnover, because it only looks at cutters.Prevalence is the share of seasoned listings - those on the market at least 30 days - that
are cutting. The seasoning requirement matters because the probability that a listing is cutting depends steeply on how long it has been listed:Days on market
Probability of cutting
0–15
3%
30–45
27%
60–75
49%
180+
~64%
A fresh listing simply hasn't had time to cut. So the raw cut rate moves with the age mix of
inventory even when seller behavior is unchanged - a spring flood of new listings can pull the blended cut rate down without anyone becoming less motivated. To prevent that, cut rates are standardized to a fixed reference age mix before they feed the index, rather than reading the blended rate directly.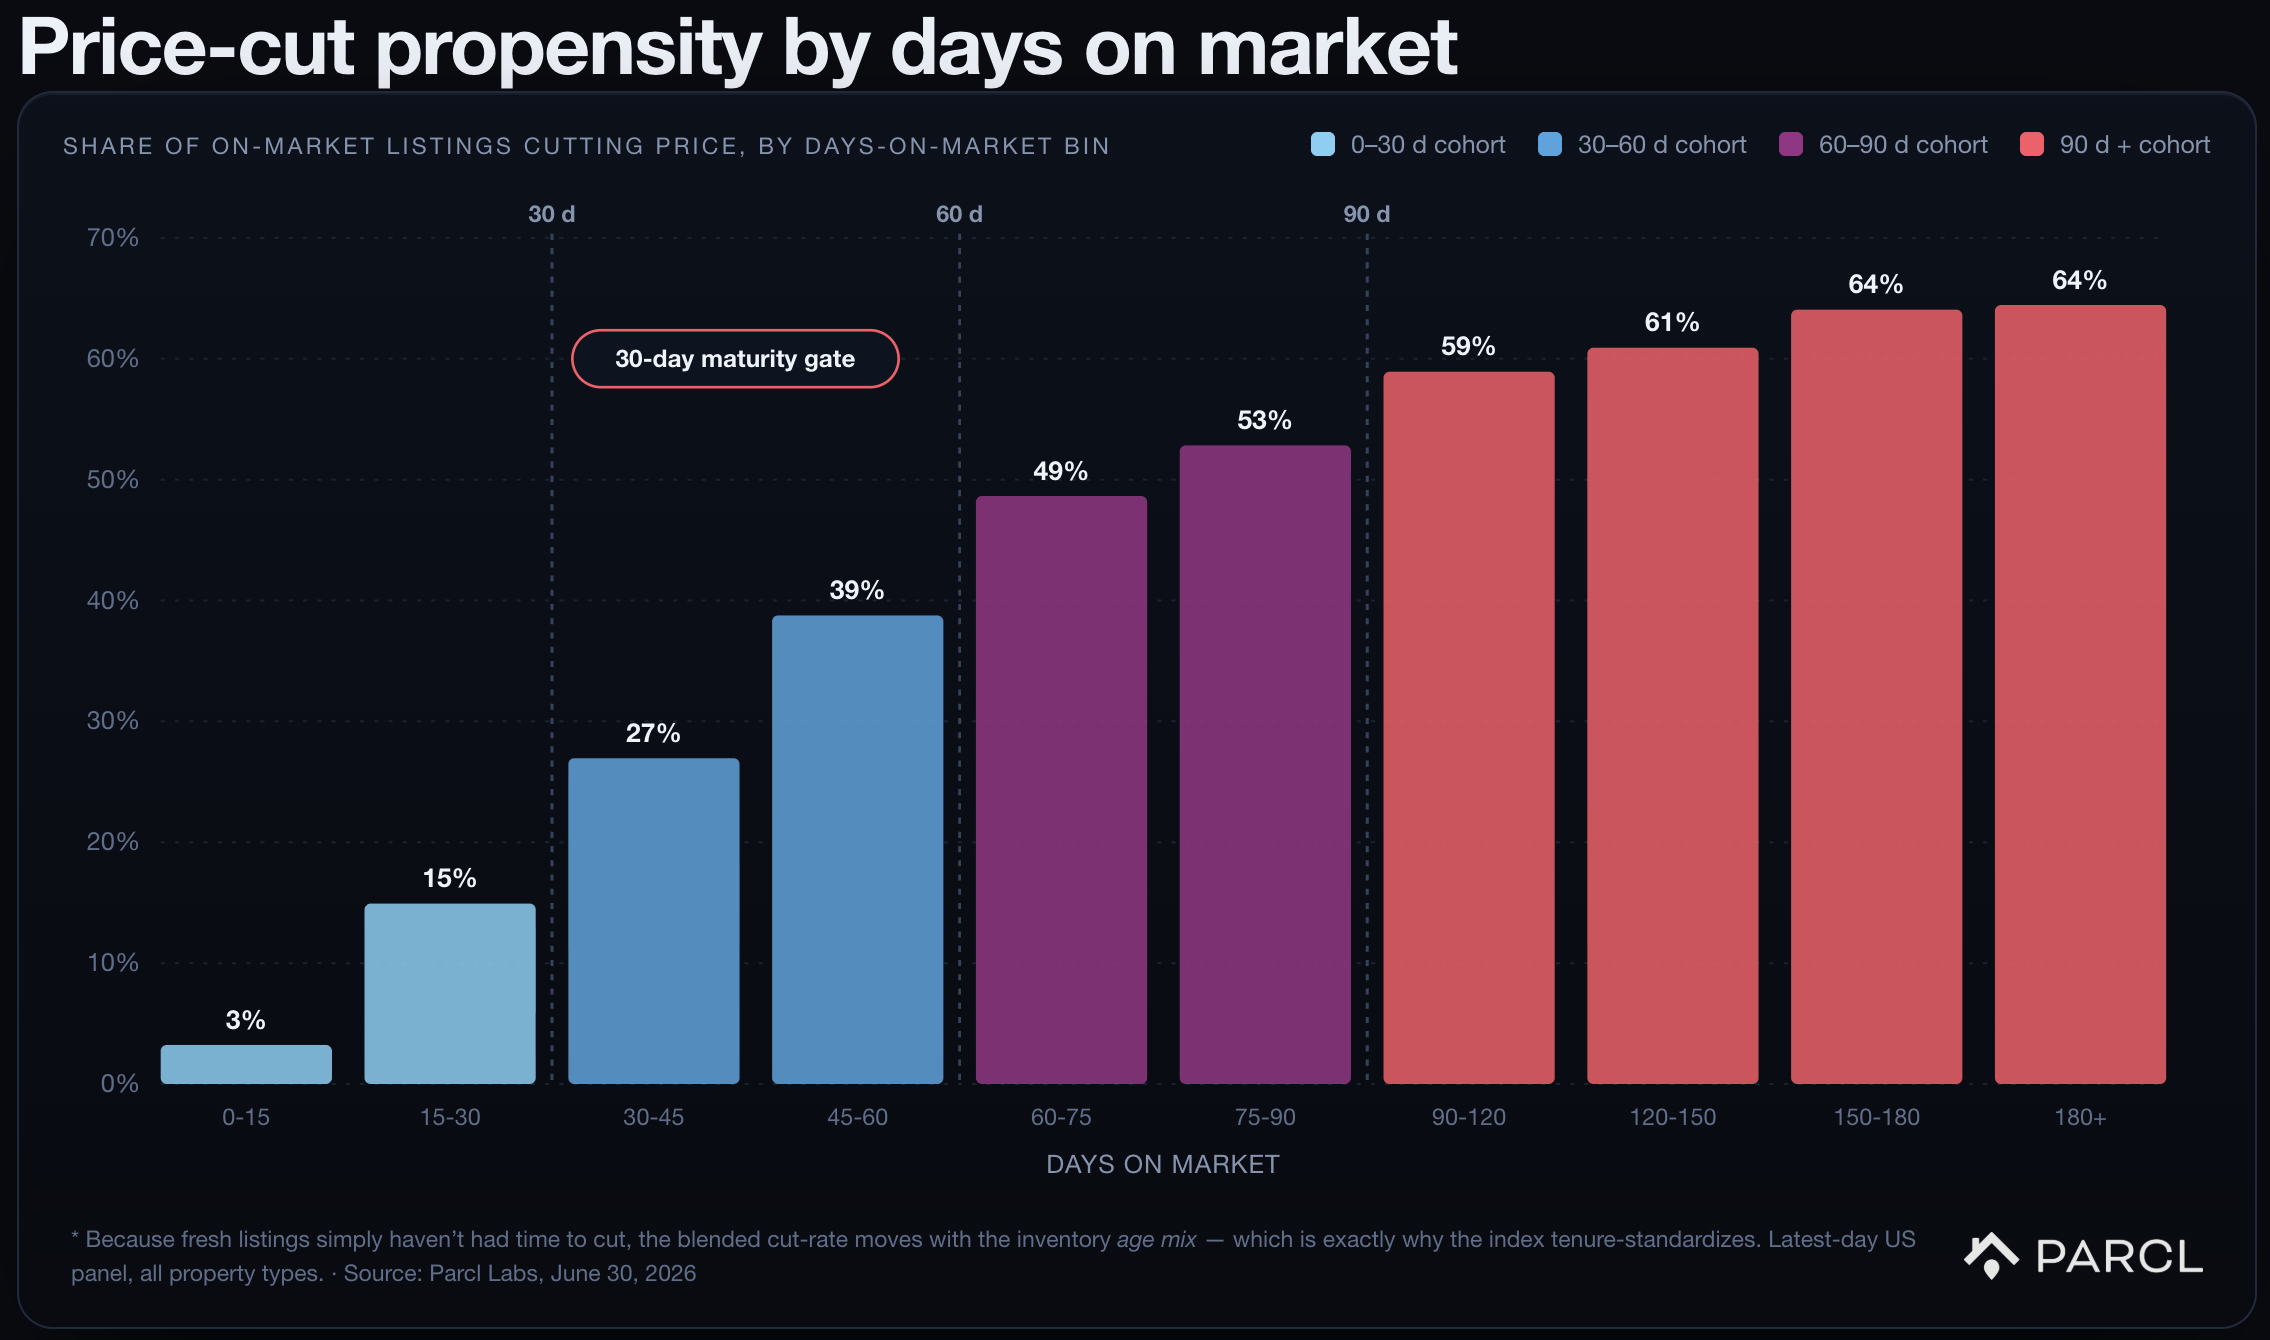
Scale (k) is a fixed constant that places the typical market near 5 on the 0–10 range. It
is set once, not re-fit each period, so genuine movement over time is preserved.
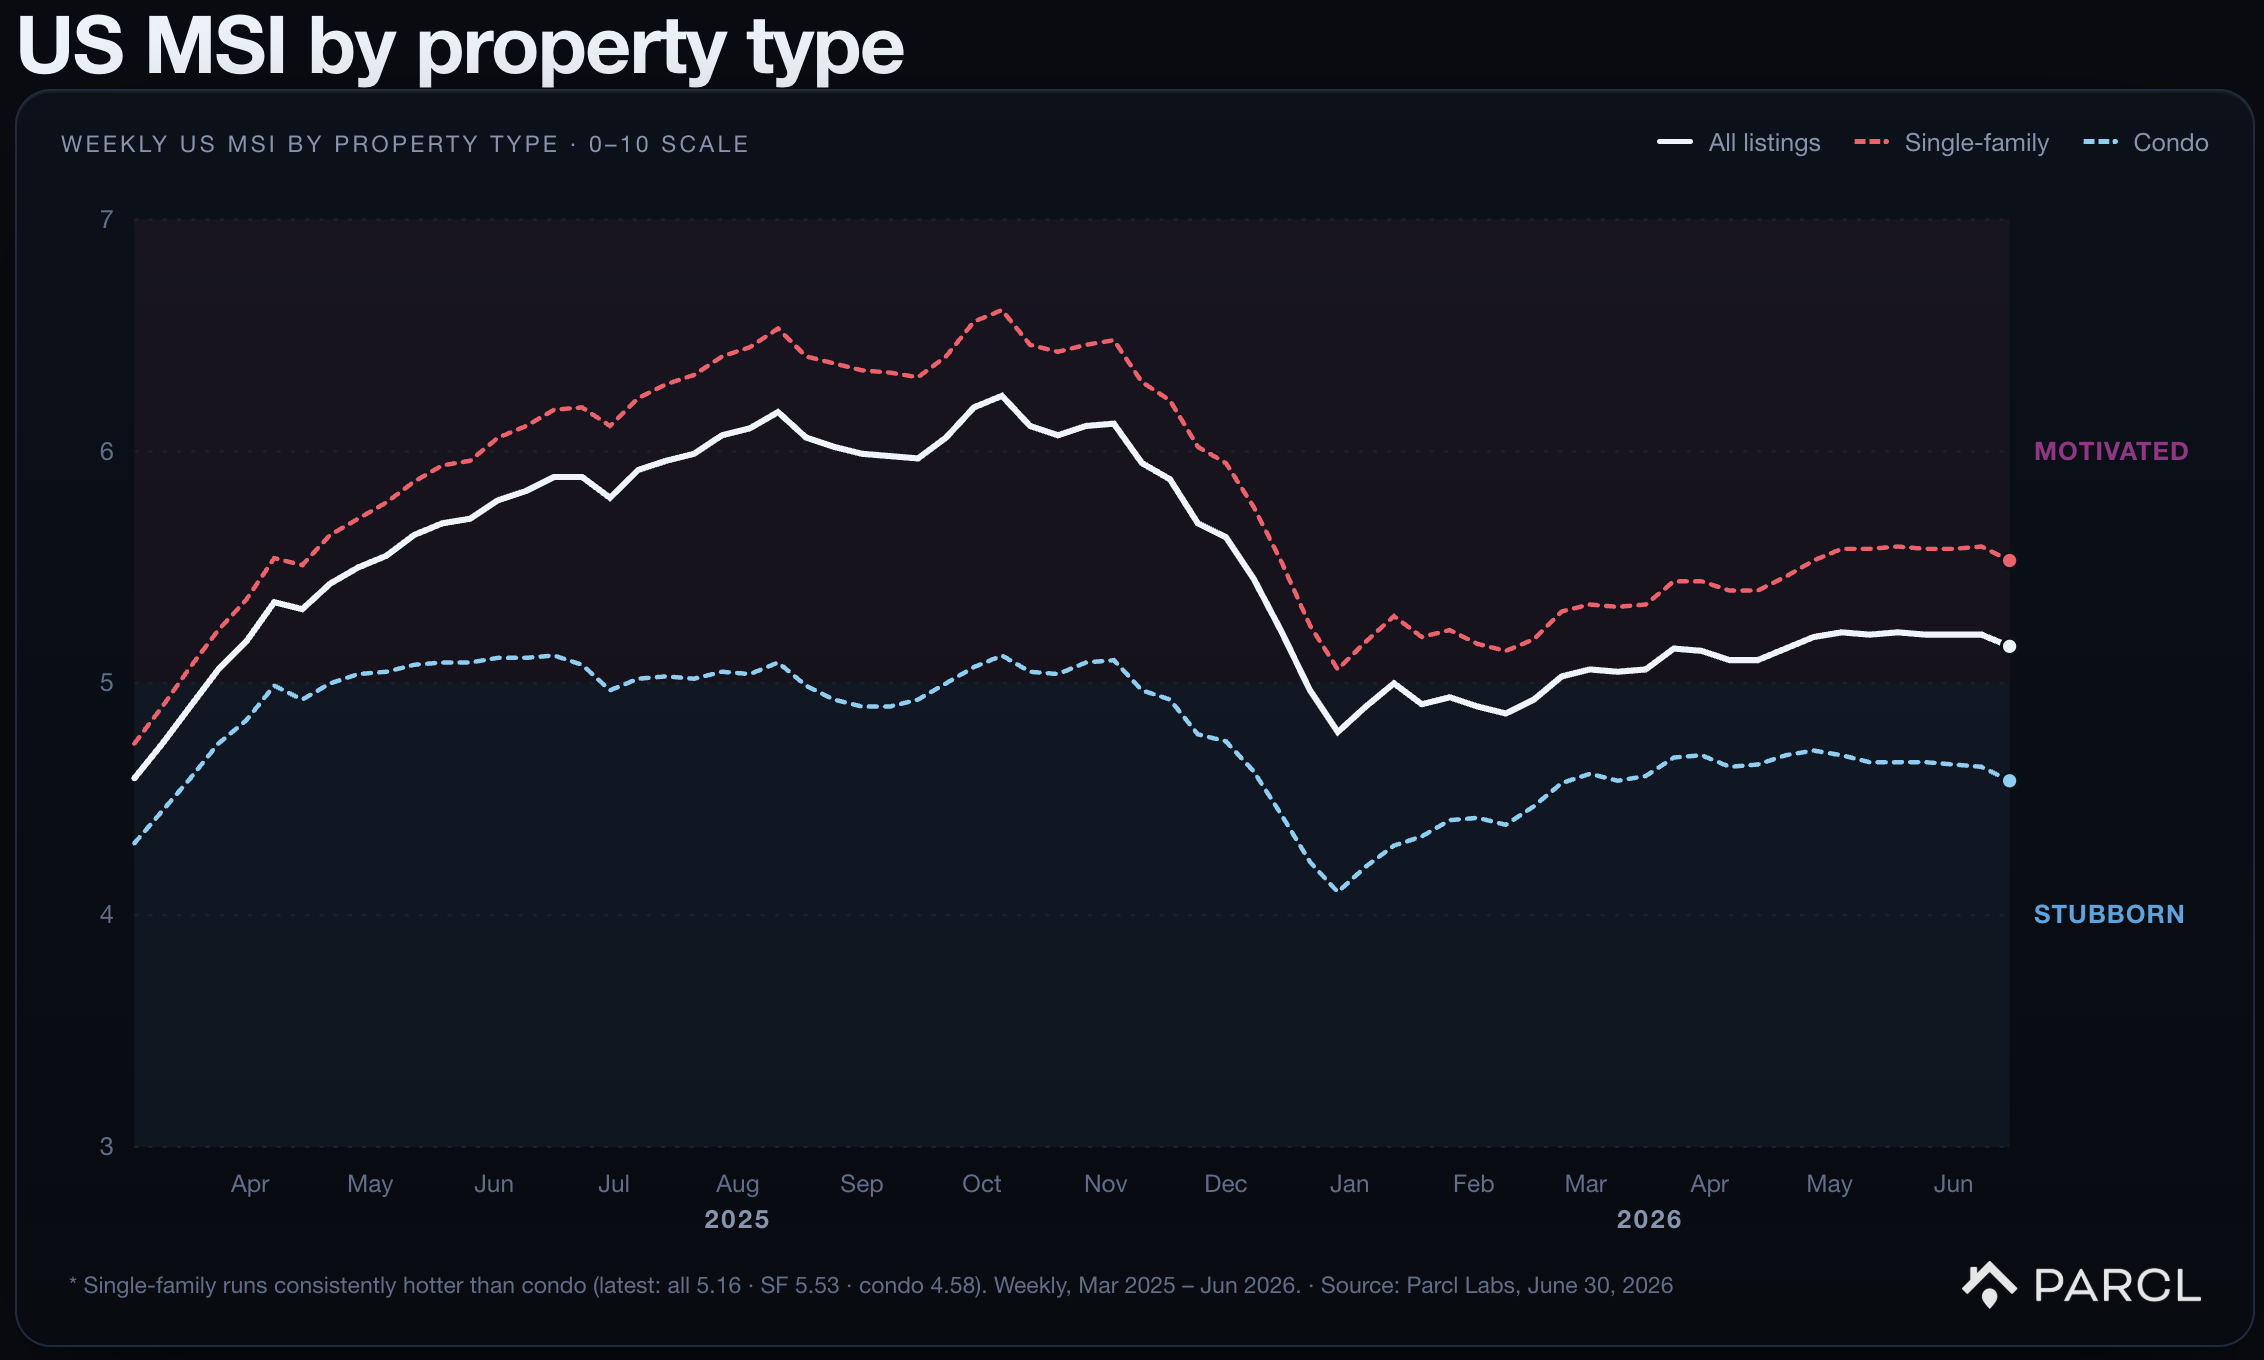
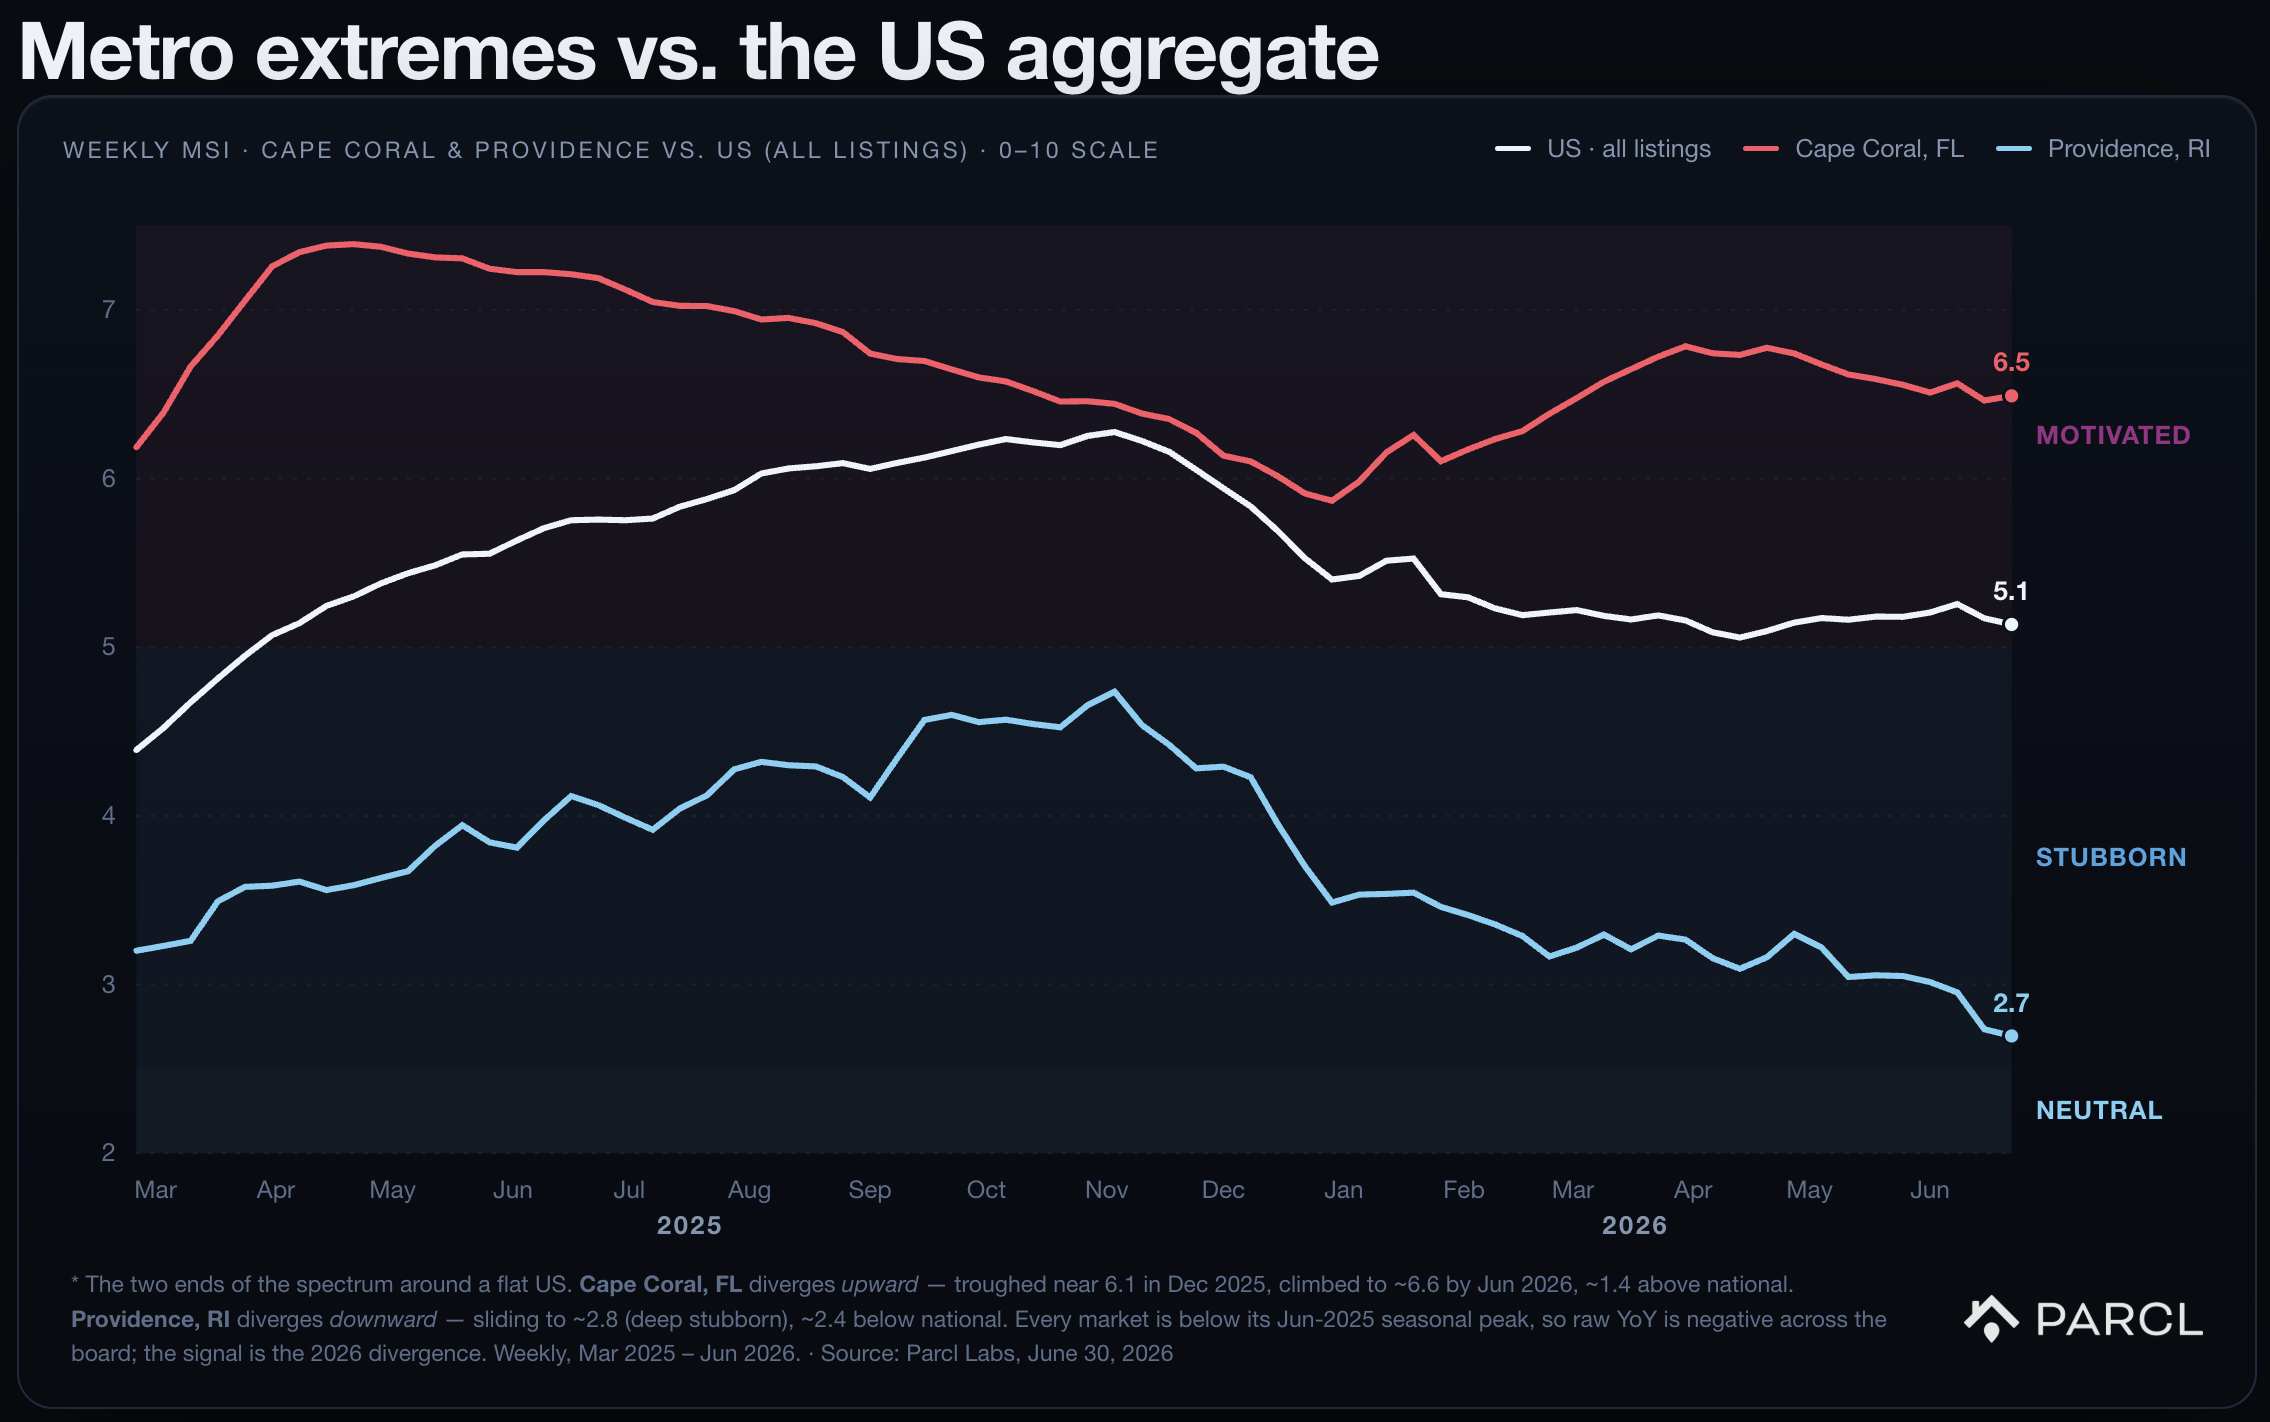
The market score is produced for every geography (ZIP, city, county, metro, and national) and for three property segments - all homes, single-family, and condo - each scored independently.
Markets are labeled:
Label | MSI |
|---|---|
Neutral | below 2.5 |
Stubborn | 2.5 to 5.0 |
Motivated | 5.0 to 7.5 |
Fire sale | 7.5 or above |
4. Validation - the labels predict the outcome
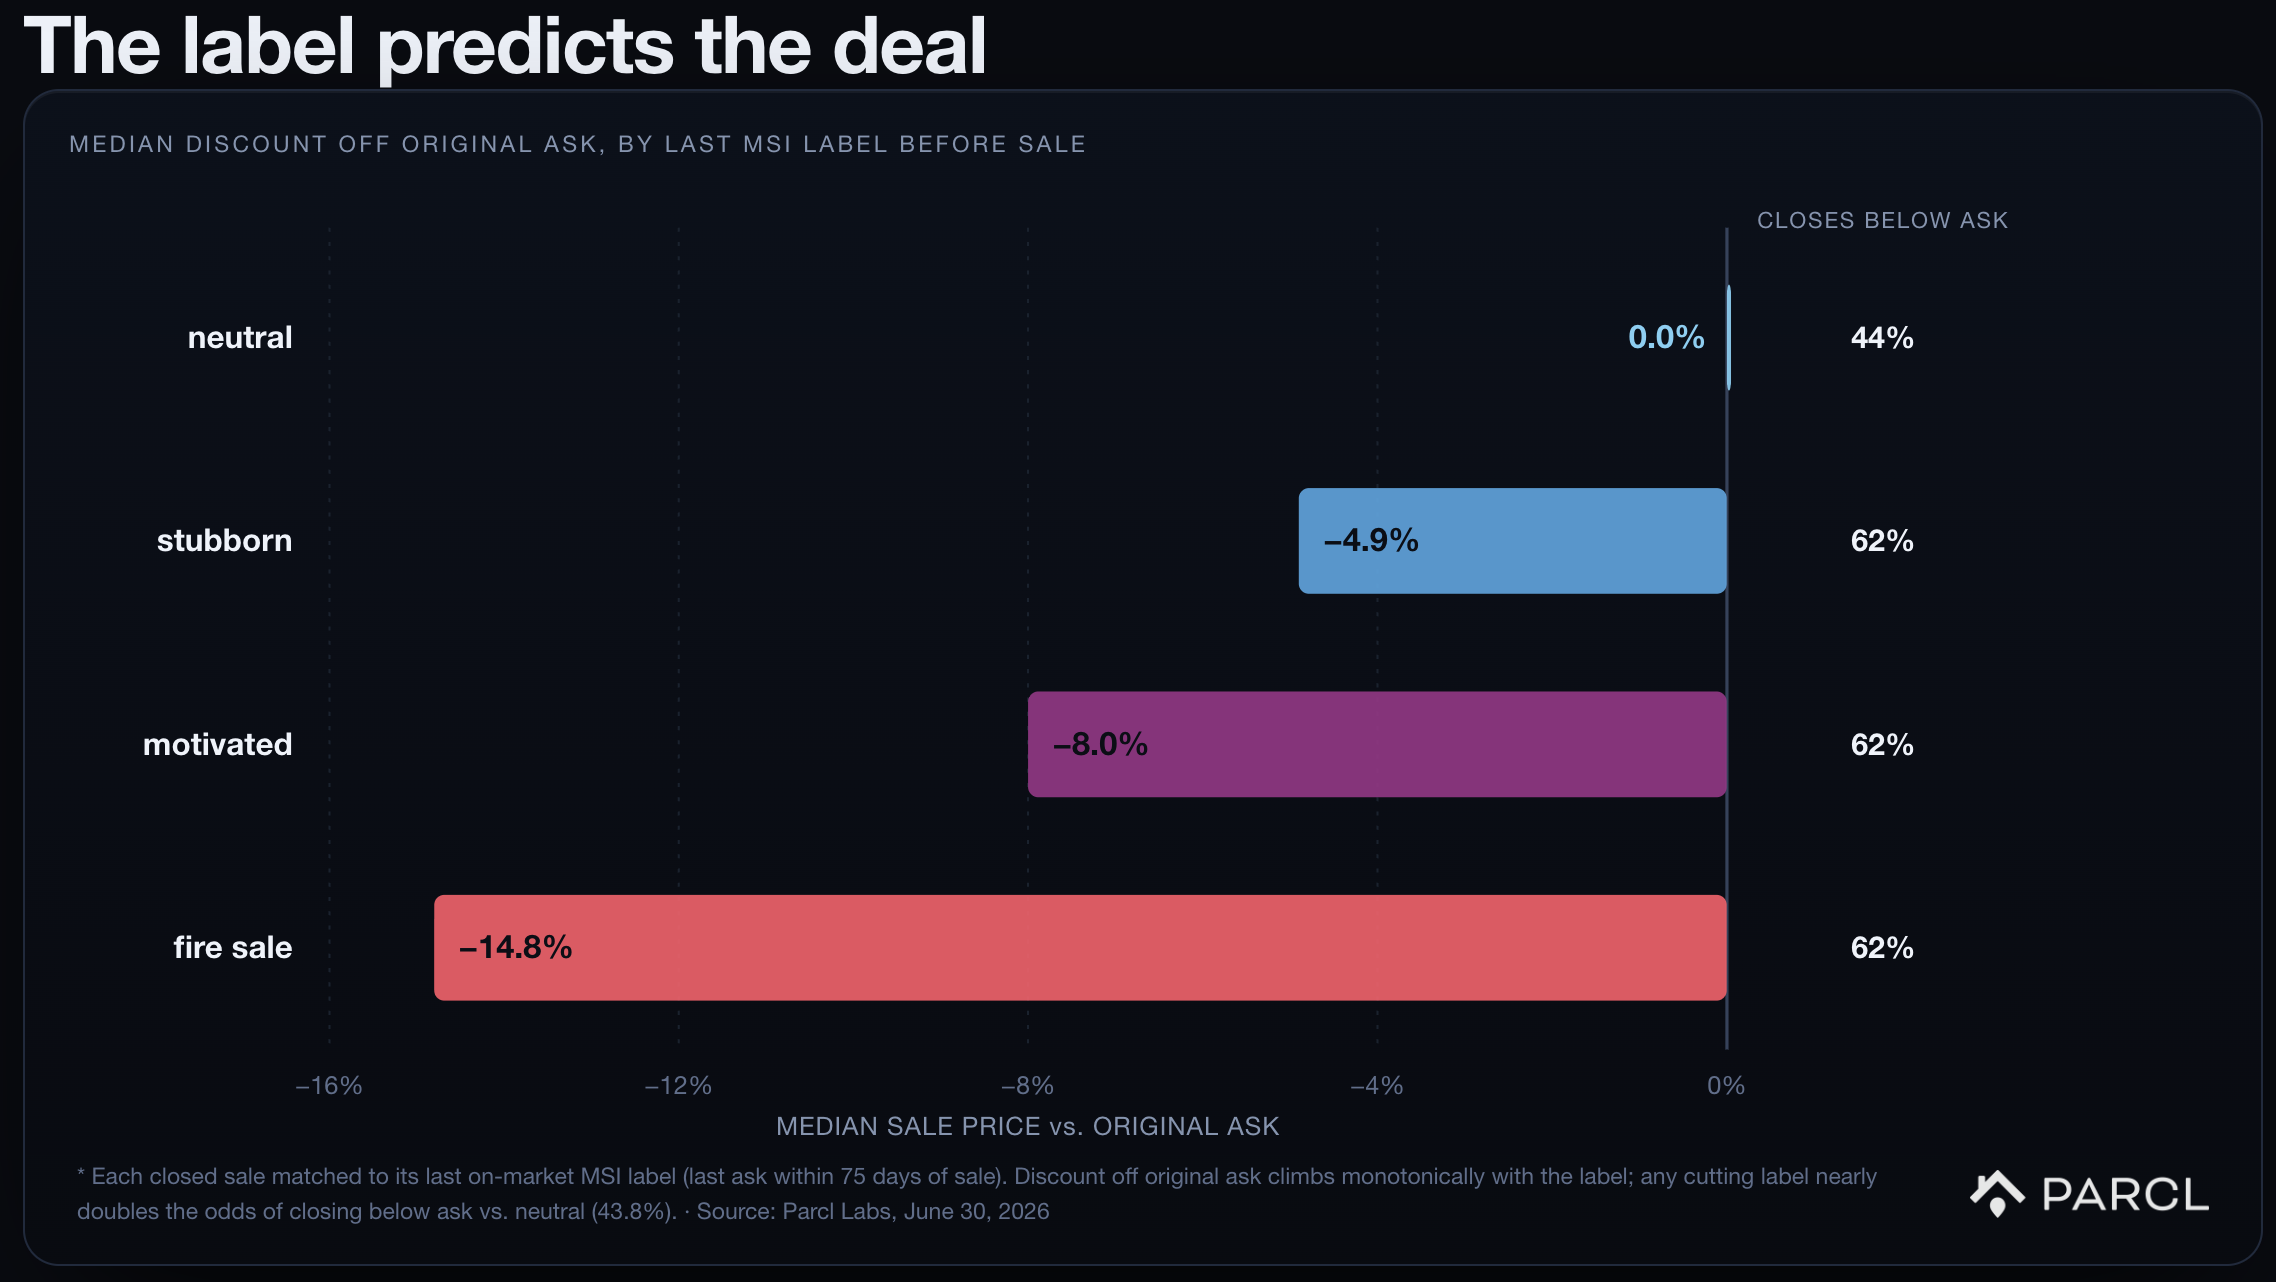
The labels are not merely descriptive; they predict how a listing actually sells. Matching roughly 3.1 million closed sales to each listing's last MSI label before it sold:
Last label | Sales | Median vs last ask | Median vs original ask | Closes below ask | Odds of closing below ask |
|---|---|---|---|---|---|
Neutral | 2.10M | 0.0% | 0.0% | 43.8% | 0.78-to-1 |
Stubborn | 0.47M | −1.6% | −4.9% | 62.4% | 1.66-to-1 |
Motivated | 0.28M | −1.7% | −8.0% | 62.0% | 1.63-to-1 |
Fire sale | 0.30M | −2.0% | −14.8% | 61.8% | 1.62-to-1 |
Two distinct, useful signals emerge:
Who sells below ask. Any listing carrying a cutting label closes below its last asking price
about 62% of the time (≈ 1.6-to-1 odds), versus 43.8% (0.78-to-1) for a neutral listing —
roughly double the odds.How deep the deal goes. The discount off the original asking price climbs with the label —
neutral 0%, stubborn −4.9%, motivated −8.0%, fire sale −14.8%. A fire-sale listing closes
about 15% below where it first listed (roughly $59,000 off a $400,000 home), versus
essentially nothing for a neutral listing.
The index also surfaces urgency that the on-market price-cut signal alone cannot see -
sellers who quietly accept a below-asking offer without ever posting a visible price cut. This is
most pronounced among the longest-tenured listings.
This same pattern is observed when comparing the last list price to the closed sale transaction, i.e. the unobservable activity that transpires in the final leg of negotiation. This snapshot for the country was taken on July 1, 2026:
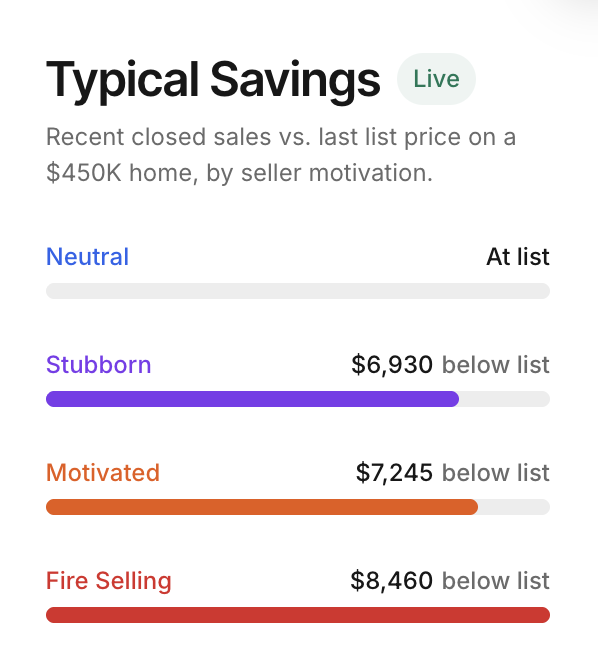
This varies by market and by time. To get a current read on your market, we publish this daily for 50k+ markets nationwide and the US aggregate on our public tool.
5. A leading indicator of price
Because urgency precedes price adjustment, the MSI leads price movement. Correlating the US MSI against the week-over-week change in the US price index across a range of lead times shows a clear, directional relationship.
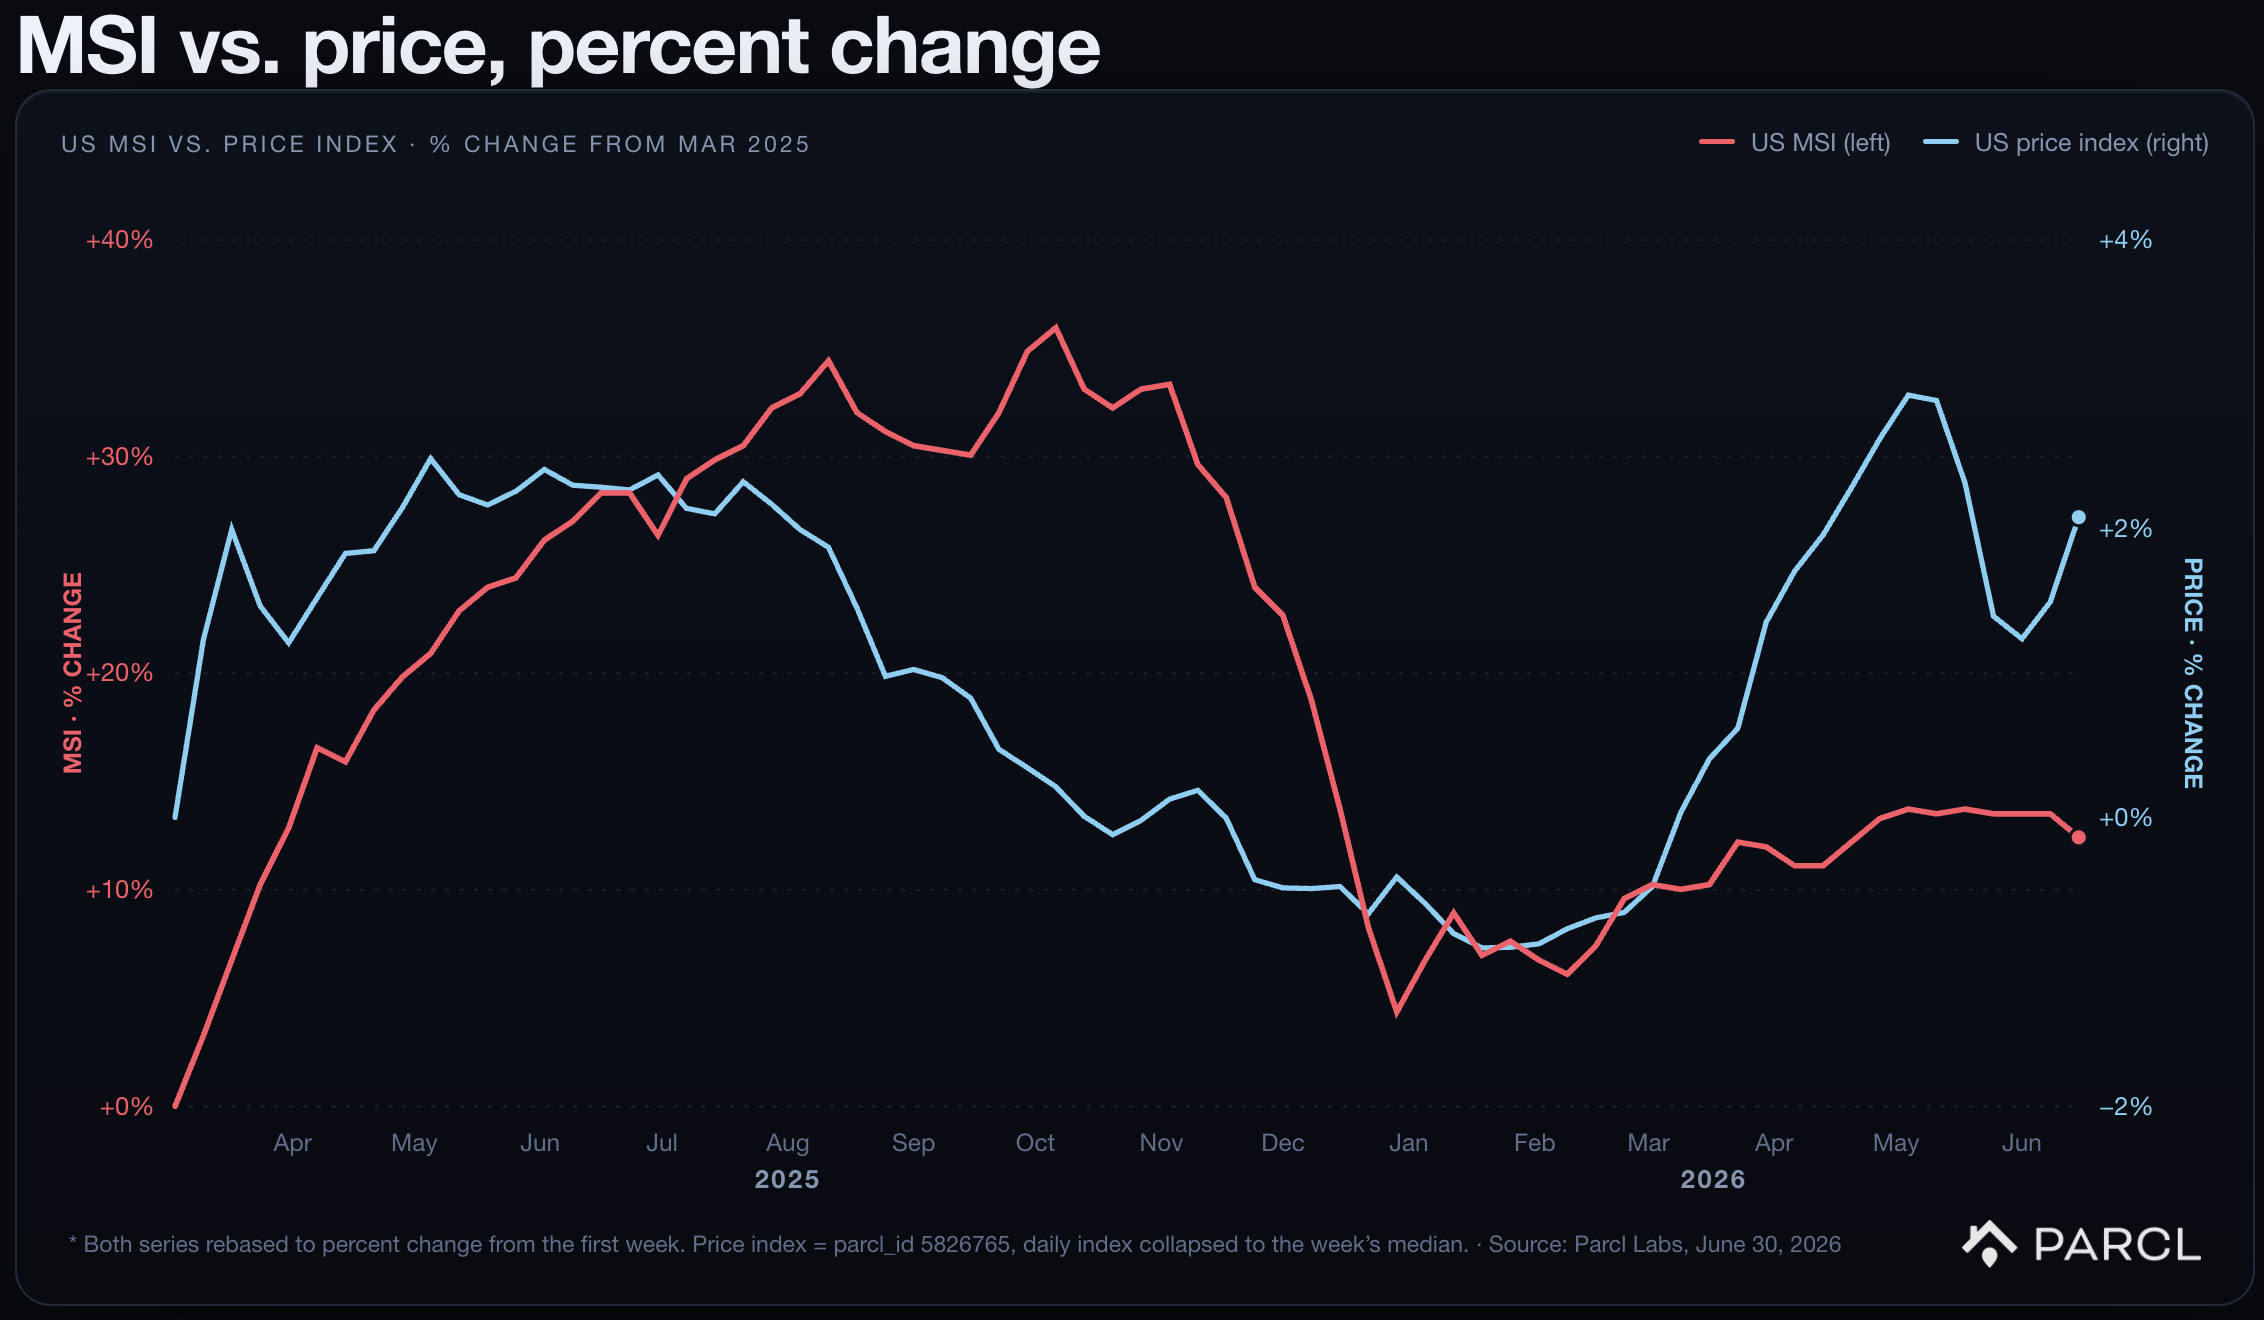
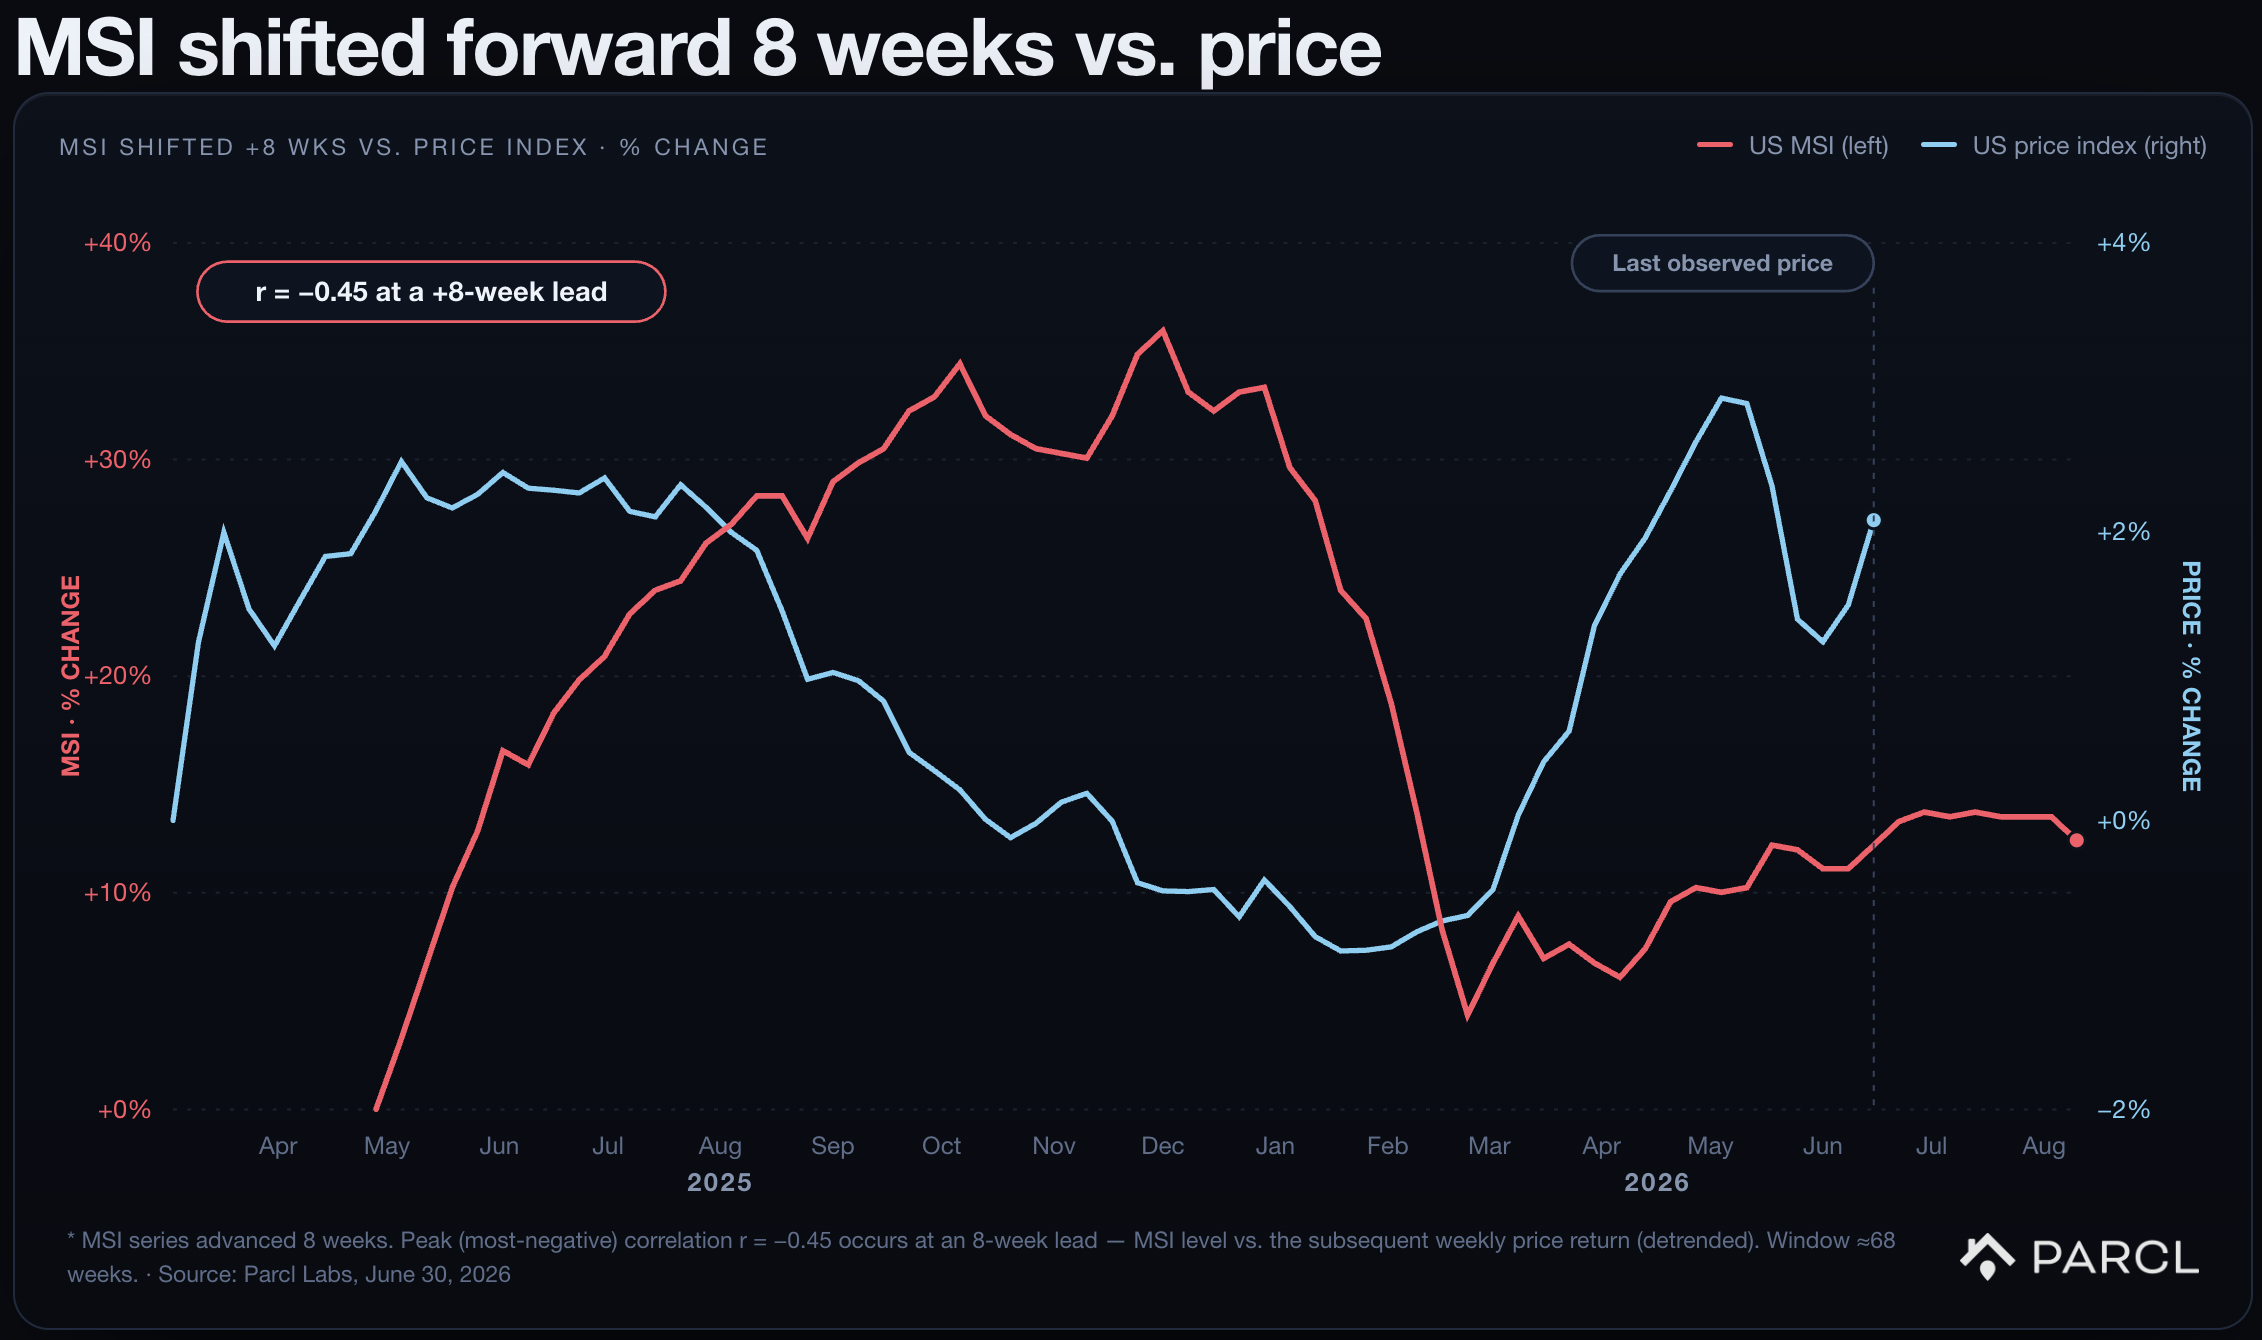
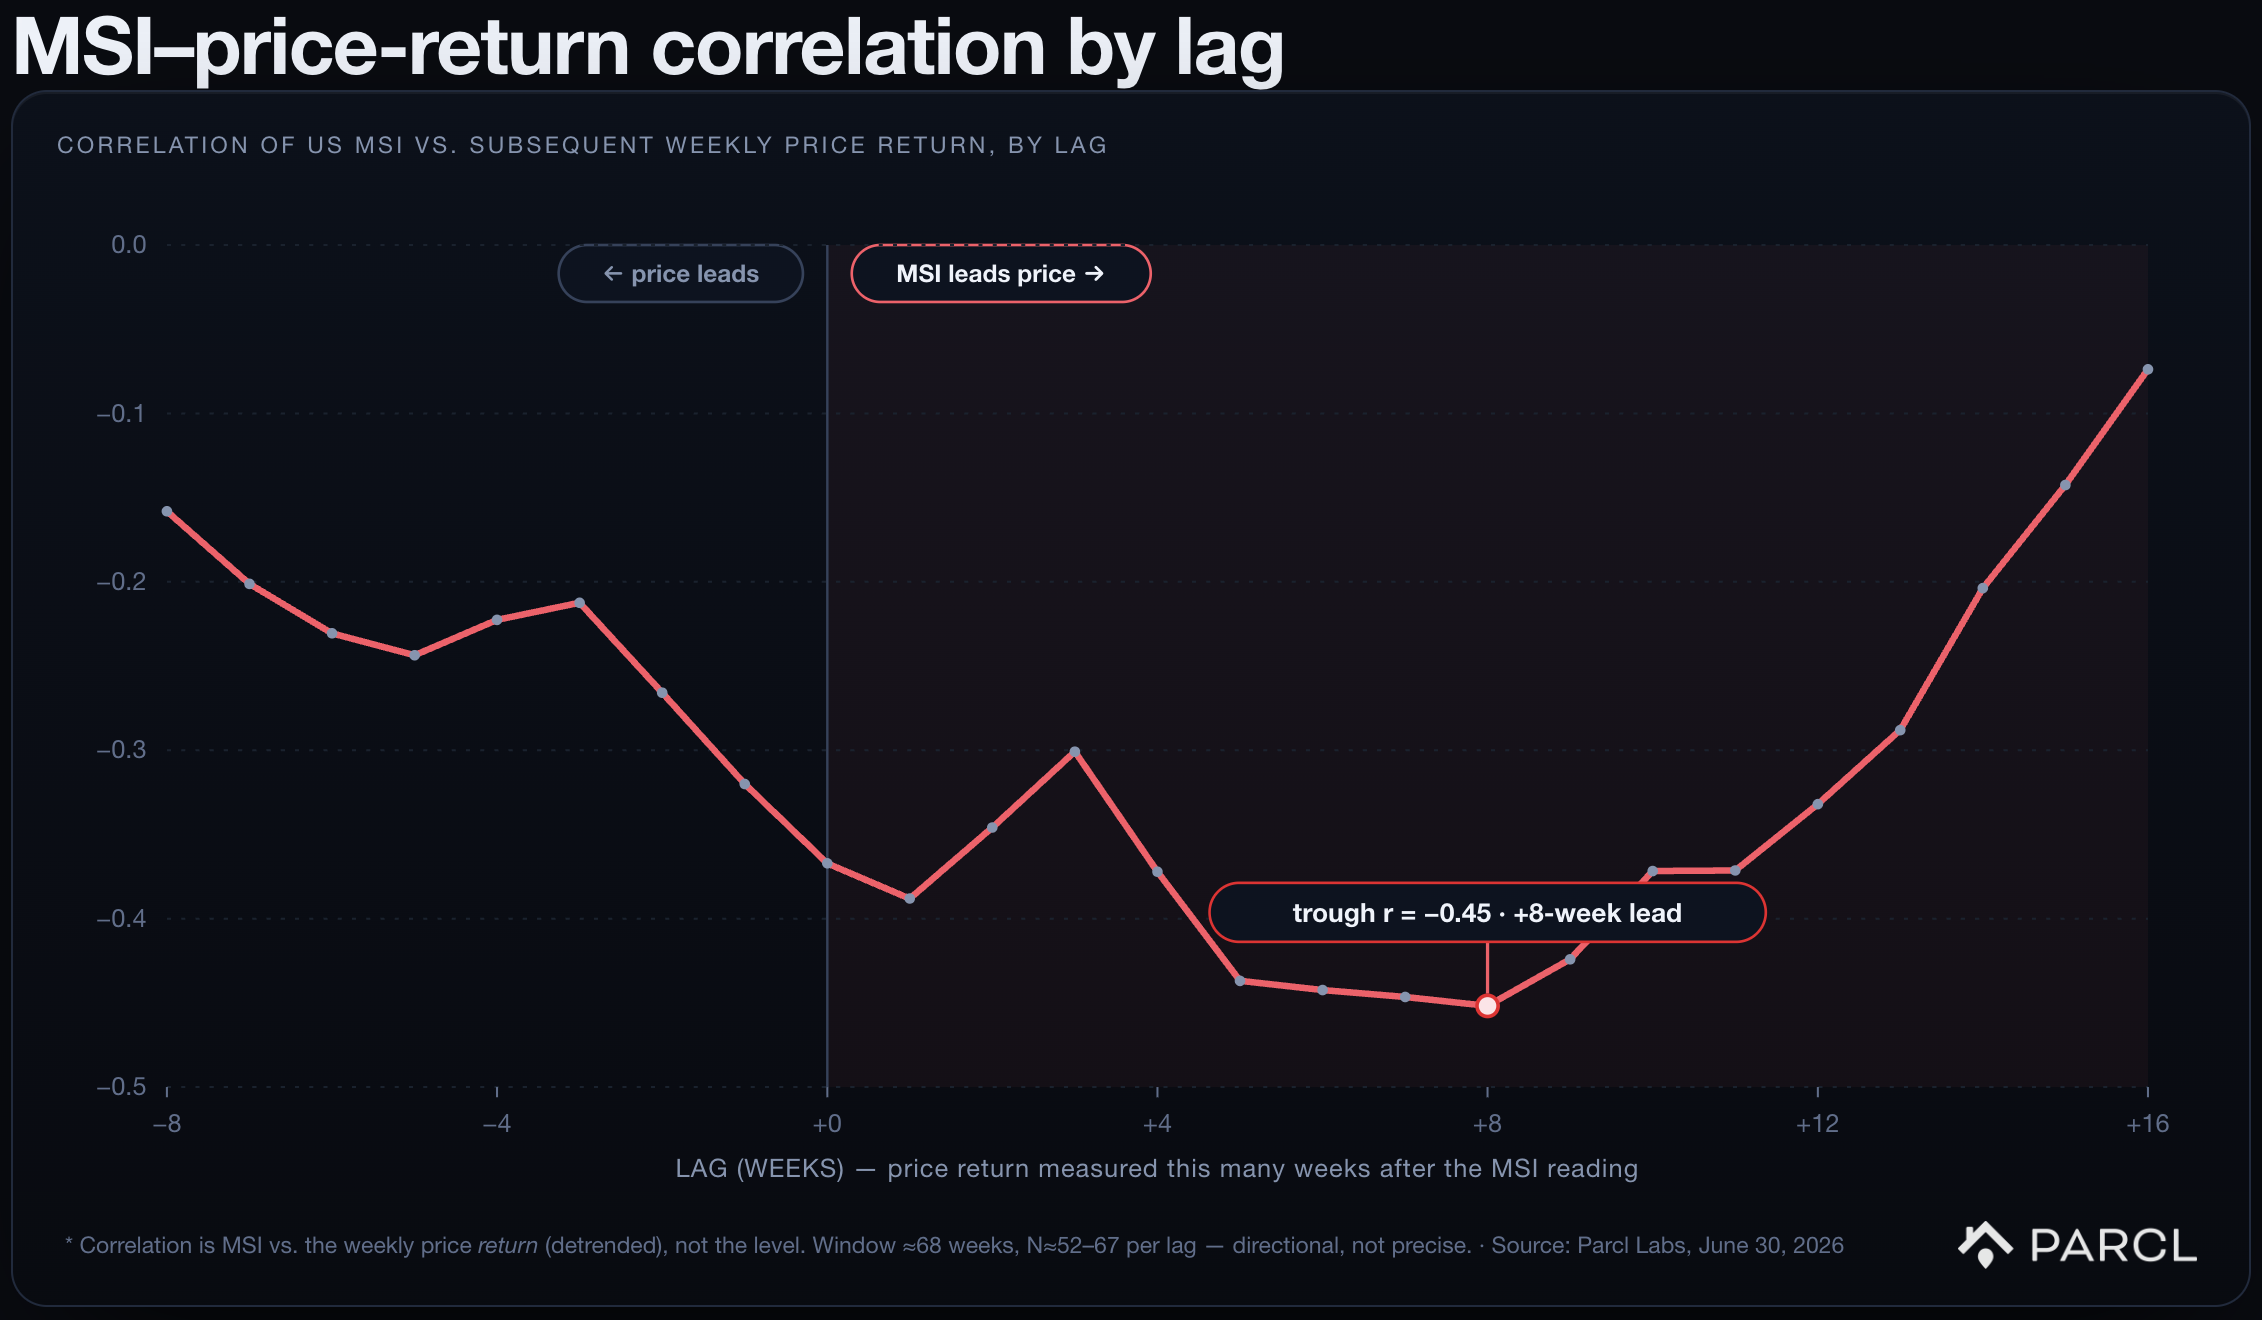
The inverse correlation reaches a clear trough of ≈ −0.45 at a roughly 7–8-week lead and is weak at both extremes - the signature of a genuine lead (it peaks at the true lead time and decays beyond it). In plain terms: a rising MSI today anticipates softer price growth about two months out. The correlation is computed against the price change, not the price level, to avoid the spurious relationship that two trending series can produce.
6. Coverage and scope
The index covers every active for-sale listing, including new construction and builder inventory - not just resale homes. This is intentional: builder pricing behavior is part of seller urgency. Ownership is resolved as of each date, so a listing's cuts are always credited to whoever actually held the home at that time, rather than to its present-day owner.



Follow Us for More